Technical Analysts Say Weak Trend Strength Is Keeping the Market Directionless; ADX Above 25 and a Breakout Beyond 24,800 Could Signal the Next Phase of the Rally
The Indian equity market continues to witness an intense battle between buyers and sellers, with the Nifty 50 struggling to establish a clear trend despite several attempts to break out over the past few weeks. Since the breakout witnessed in mid-June, the benchmark index has remained trapped within a narrow trading range, frustrating both bullish and bearish traders.
Market experts believe the absence of a strong directional move is primarily due to weakening momentum, which is clearly reflected in the Average Directional Index (ADX)—a popular technical indicator used to measure the strength of a market trend.
Although the benchmark index briefly tested higher levels above 24,500 earlier this month, it failed to sustain momentum and has since oscillated between key support and resistance zones. On Wednesday, amid broad-based selling pressure, the Nifty once again tested the important psychological support of 24,000, highlighting the continued indecision among market participants.
According to technical analysts, the coming weeks could prove decisive as narrowing price action, quarterly earnings announcements, monthly derivatives expiry, and global developments may collectively determine the market's next major trend.
Nifty Continues to Trade in a Consolidation Zone
The benchmark index has remained largely range-bound after breaking out above previous resistance in June.
Instead of extending the rally, the market has entered a consolidation phase where buying and selling pressure remain evenly balanced.
Current Technical Range
| Level | Importance |
|---|---|
| 23,650 – 23,800 | Strong Support Zone |
| 24,000 | Psychological Support |
| 24,350 | Near-Term Bullish Pivot |
| 24,400 – 24,550 | Immediate Resistance |
| 24,800 | Major Breakout Level |
Repeated testing of both support and resistance without follow-through indicates that investors are waiting for a fresh catalyst before taking aggressive positions.
Understanding the ADX Indicator
One of the most important indicators currently being monitored by technical analysts is the Average Directional Index (ADX).
Unlike indicators that attempt to predict market direction, the ADX simply measures the strength of an existing trend.
How ADX Works
| ADX Reading | Market Interpretation |
|---|---|
| Above 25 | Strong trending market |
| Between 20–25 | Trend beginning to strengthen |
| Below 20 | Weak or sideways market |
A rising ADX indicates increasing momentum, while a falling ADX suggests weakening conviction among both buyers and sellers.
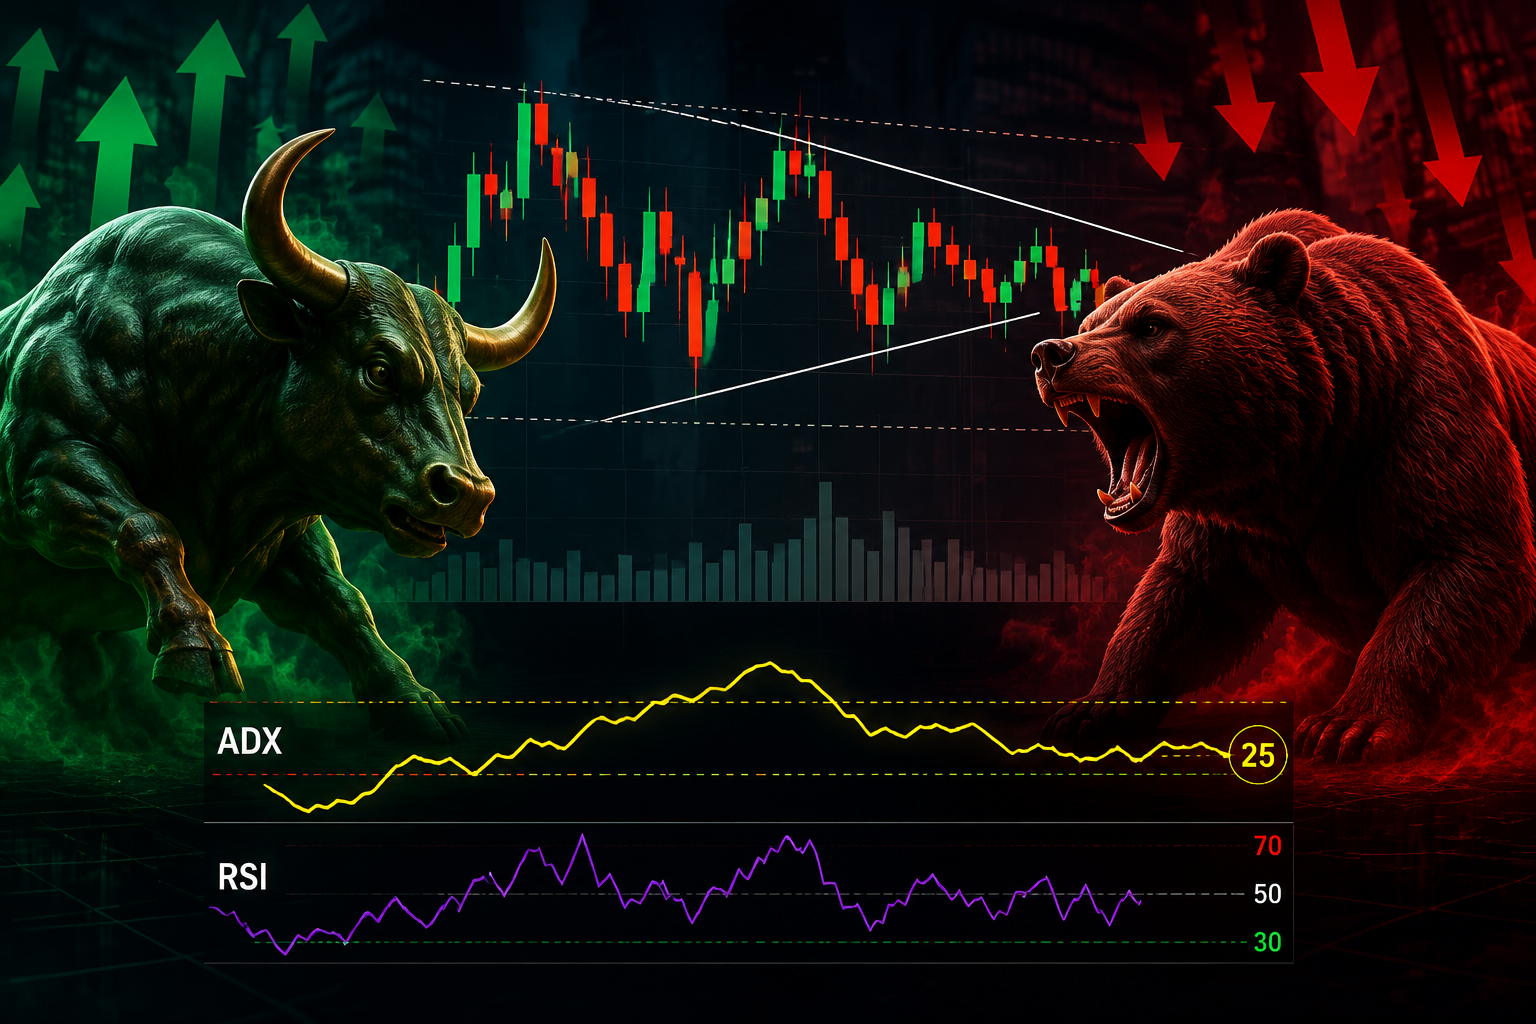
At present, the indicator remains below the crucial 25 level, signalling that the market lacks the momentum required for a sustained breakout.
Why Is the Market Moving Sideways?
According to technical experts, several factors have contributed to the prolonged consolidation.
Major Reasons
-
Lack of strong institutional buying.
-
Mixed corporate earnings expectations.
-
Global geopolitical uncertainties.
-
Rising crude oil prices.
-
Cautious foreign investor activity.
-
Monthly derivatives positioning.
-
Profit booking after recent gains.
Together, these factors have created an environment where neither bulls nor bears have gained decisive control.
Triangle Formation Suggests a Big Move Ahead
Technical analysts believe the Nifty is gradually forming a symmetrical triangle pattern, a chart formation often associated with periods of consolidation before a sharp directional breakout.
The pattern is formed by connecting:
-
Lower highs from recent peaks.
-
Higher lows formed over the past several months.
As the trading range narrows, market volatility typically contracts before expanding sharply once the breakout occurs.
Historically, such patterns often precede significant market moves, provided the breakout is supported by strong trading volumes.
RSI Also Indicates Momentum Remains Neutral
Apart from ADX, analysts are closely monitoring the Relative Strength Index (RSI).
The RSI measures the speed and magnitude of price movements and helps determine whether an asset is overbought or oversold.
Key RSI Levels
| RSI Reading | Interpretation |
|---|---|
| Above 70 | Overbought |
| Above 60 | Strong Bullish Momentum |
| Above 50 | Positive Trend |
| Below 30 | Oversold |
According to analysts, a sustained move above 60 would significantly strengthen the bullish case for the Nifty.
Religare Broking: Watch ADX Above 25
Technical analysts at Religare Broking believe investors should focus more on trend confirmation rather than attempting to predict market direction.
According to the brokerage:
-
The ADX has been weakening since the Nifty's peak near 24,531.
-
Directional Indicator (DI) readings continue to show negative divergence.
-
A meaningful directional move is likely only after the ADX rises above 25.
The brokerage expects market volatility to increase as the derivatives expiry approaches and corporate earnings continue to influence sentiment.
HDFC Securities: Earnings Season Keeping Index Range-Bound
Technical analysts at HDFC Securities attribute the subdued ADX reading to the ongoing earnings season.
According to their assessment:
-
Markets often remain range-bound during quarterly result announcements.
-
Investors prefer stock-specific opportunities rather than aggressive index positions.
-
The broader market has already underperformed several global indices over the past 18 months.
Despite higher crude oil prices and geopolitical uncertainties, domestic institutional buying has helped prevent a sharp correction.
Crude Oil and Global Events Continue to Influence Sentiment
Global developments remain an important variable for Indian equities.
Although crude oil prices have experienced significant volatility, the Nifty has remained surprisingly resilient.
Even after:
-
Falling crude prices,
-
Geopolitical developments,
-
US-Iran tensions,
-
Fluctuating global markets,
the benchmark index has continued to trade within the same broad range.
This suggests that domestic liquidity has offset much of the global uncertainty.
Key Levels Traders Should Watch
Bullish Triggers
-
Sustained move above 24,350
-
Breakout above 24,550
-
Strong confirmation above 24,800
-
ADX crossing 25
-
RSI sustaining above 60
Bearish Signals
-
Breakdown below 24,000
-
Fall below 23,800
-
Close below 23,650
-
Weak ADX and declining RSI
These levels are expected to guide short-term trading strategies over the coming weeks.
What Could Trigger the Next Directional Move?
Several upcoming events could determine whether the market breaks out or slips lower.
Key Catalysts
-
Q1 FY27 corporate earnings.
-
Monthly F&O expiry.
-
Foreign Institutional Investor (FII) flows.
-
Crude oil price movement.
-
US Federal Reserve commentary.
-
Global geopolitical developments.
-
Domestic macroeconomic data.
Any meaningful surprise in these factors could provide the momentum currently missing from the market.
Investment Perspective
The broader market remains fundamentally supported by strong domestic liquidity, resilient corporate earnings expectations, and continued retail participation. However, the technical setup suggests patience may be more rewarding than aggressive positioning until the index confirms a decisive breakout. Traders should focus on disciplined risk management and wait for confirmation through price action and improving momentum indicators before increasing directional exposure.
Smart Investment Analysis
The Nifty's prolonged consolidation is a classic example of a market waiting for fresh triggers rather than displaying structural weakness. The declining ADX confirms that trend strength remains limited, while the narrowing trading range indicates that a significant move could be approaching. Investors should closely monitor whether the ADX moves above 25 along with stronger RSI readings and increased trading volumes, as these factors would provide stronger evidence of a sustainable trend. Until then, stock-specific opportunities and disciplined portfolio management are likely to outperform aggressive index-based strategies.
Key Takeaways
-
Nifty has remained trapped between 23,800 and 24,400 despite multiple breakout attempts.
-
The Average Directional Index (ADX) remains below 25, indicating weak trend strength and a lack of market direction.
-
Analysts believe the index is forming a symmetrical triangle pattern, often a precursor to a major breakout or breakdown.
-
A sustained RSI above 60 and ADX above 25 would strengthen the case for a bullish trend.
-
24,800 is the key resistance level needed to confirm a fresh medium-term uptrend, while 23,800–23,650 remains the crucial support zone.
-
Investors should monitor quarterly earnings, F&O expiry, crude oil prices, and institutional flows for clues about the market's next significant move.